
One of the biggest challenges in agricultural innovation is not developing new technology—it is proving that it works.
For decades, pest monitoring has relied on conventional traps that are inspected periodically by technicians. These methods remain essential and provide valuable information, but they also require significant time and effort to collect, process and interpret data.
Within Project CERBERUS, monitoring data are generated through a combination of field observations, laboratory analyses and digital tools, as described in “From Field to Lab: How CERBERUS Standardises Pest and Disease Monitoring in Mediterranean Crops”. Once these data have been collected, the next challenge is transforming them into meaningful insights that support decision-making.
This is where the CERBERUS Analytics module comes into play.
Turning monitoring data into insights
The CERBERUS platform includes a dedicated analytics section that allows users to compare data from conventional traps and smart traps through intuitive visualisations.
Rather than viewing isolated observations, users can analyse complete time series and explore how different monitoring systems behave throughout the season. The platform allows users to display only the datasets they are interested in, making it easy to compare individual traps, groups of traps or different monitoring approaches.
This functionality helps researchers, technicians and farmers better understand pest dynamics and evaluate monitoring performance under real field conditions.
For example, the monitoring data generated through the laboratory counting procedures described in “Citrus Pest Monitoring: How Ceratitis capitata Is Counted in the Laboratory” can be visualised and compared through the Analytics module, providing a clearer picture of pest population trends over time.
To help users make the most of these tools, CERBERUS has developed a dedicated Analytics tutorial, which provides a guided walkthrough of the platform’s visualisation and comparison features. The tutorial demonstrates how to select data series, compare trap performance and export charts for reporting and analysis.
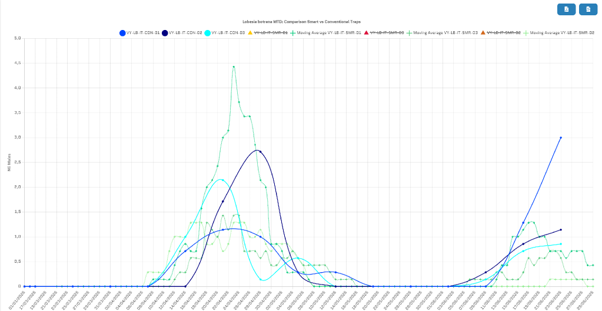
Why do smart traps detect peaks earlier?
One of the most interesting observations that emerges from the analytics tools is that smart traps often identify pest population peaks earlier than conventional traps.
This does not necessarily mean that one trap captures more insects than the other.
The difference lies in the frequency of observation.
Conventional traps are typically inspected once a week, meaning that changes occurring between visits remain unknown until the next inspection. Smart traps, on the other hand, collect and transmit information every day.
As a result, sudden increases in pest activity can be detected earlier, providing a more detailed picture of population dynamics.
For farmers and technicians, this means greater situational awareness and potentially faster responses when pest pressure begins to increase.
A new level of transparency for pest monitoring
Beyond comparison, the analytics module provides a transparent way to validate emerging technologies.
Researchers can visualise trends, compare monitoring methods and identify differences between data sources. Charts can be exported individually as images or PDFs, or combined into comprehensive reports for further analysis and sharing.
This capability supports one of the key objectives of CERBERUS: ensuring that innovative monitoring technologies are not only developed, but also scientifically validated under real agricultural conditions.
The Analytics tutorial shows exactly how these reporting functions work, making it easier for users to generate and share insights from their monitoring data.
Building confidence in digital agriculture
The transition towards digital agriculture depends on trust.
Farmers need confidence that automated systems provide reliable information. Researchers need tools to evaluate performance. Policymakers need evidence that new approaches deliver measurable benefits.
By enabling direct comparisons between conventional and smart traps, the CERBERUS Analytics module helps build that confidence.
It transforms monitoring data into evidence, allowing users to understand not only what is happening in the field, but also how different technologies contribute to that understanding.
Because innovation is not just about collecting more data. It is about generating better insights—and proving that they can make a difference.
Learn More
Want to explore these features yourself?
The Analytics tutorial demonstrates how to:
- Compare smart traps and conventional traps
- Visualise pest population trends over time
- Analyse differences in monitoring frequency
- Export charts and reports for sharing and decision-making
The tutorial is part of the growing collection of CERBERUS App Tutorials, designed to help farmers, technicians and stakeholders make the most of the platform’s tools and functionalities.
Visit the CERBERUS App Tutorials page to access step-by-step video guides covering analytics, pest monitoring, citizen science, spraying workflows and other platform features.